 By Bill Barker, AICP
Office of Sustainability
Some people claim that the only time they get quiet time to themselves is when they are alone in the car while they commute. However, there is a great deal of research that says that the longer someone commutes, the more likely he or she is to be divorced, obese, heart-diseased and stressed. Social scientists have found a direct correlation between life happiness and commute distance: people that have shorter commutes are happier and healthier.
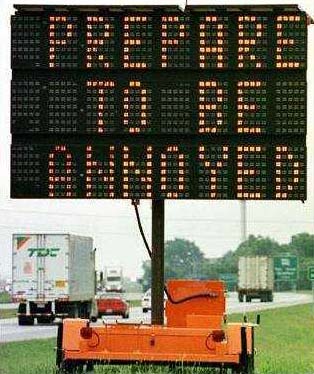
Photo courtesy of Hays County Roundup
After all, there are only 24 hours in a day. As a general rule, people have an average “travel time budget” of about 60 or so minutes – the amount of time they are willing to devote each day to transportation. Spending more time on commuting takes away from time spent with family, sleep, and other more pleasant activities. Research repeatedly shows that most people get increasingly upset when the commute becomes greater than 30 minutes each way.
This explains why average commute times don’t vary much among large cities even though the transportation systems can be very different. Some cities have high capacity rail transit while others rely on extensive freeway systems. People adjust by changing jobs, household location, travel mode, route, departure times, and/or other elements to keep their commute under 30 minutes except for the very largest cities.
Longer commute times may not be totally the result of capacity-challenged roadways and intersections, however. People often “drive until they qualify,” i.e., they end up driving further to work in order to live in a home they can afford. Parents are often concerned about the quality of school districts and may locate further from work to be in a specific school district. So, time spent commuting represents a balance of many factors. As long as people have transportation, housing and other options, they will adapt to an acceptable amount of traffic delay for their situation.
It is the unexpected delay which is the most irritating part of congestion. “Nonrecurring” congestion due to accidents, weather, construction, special events, and other intermittent factors is estimated to be 60 percent of total freeway delay. Research shows that travel time on a congested road seems from 1.5 to 2 times longer than the exact same amount of time on an uncongested road. As a result, some cities have enhanced efforts to clear the roadways more quickly to minimize the impact of these incidents.
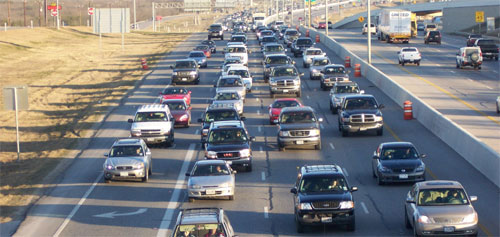
Photo courtesy of VIA Metropolitan Transit
So, what are some good ways to measure congestion? Since using an average commute time can be misleading, tracking the percentage of commute trips of 25 minutes or less is a good measure. The American Community Survey from the Census Bureau can provide an annual estimate of this for all the major modes of travel in San Antonio, so that commute times by transit, for example, are monitored as well. Given the history of average commute times, it is expected that this measure will change slowly and drift slightly upwards as the city population increases.
In order to keep this value low, it is important to have adequate transportation system capacity as well as a variety of housing and transportation options for commuters, so some useful complementary indexes to monitor these elements are also helpful.
The travel time index, the ratio of peak to off-peak travel times for motor vehicles, is produced annually by the Texas Transportation Institute and can be used to compare road speeds in San Antonio with other cities. In the view of at least some regional transportation planners, a ratio of 1.3 or less represents little or no freeway congestion.
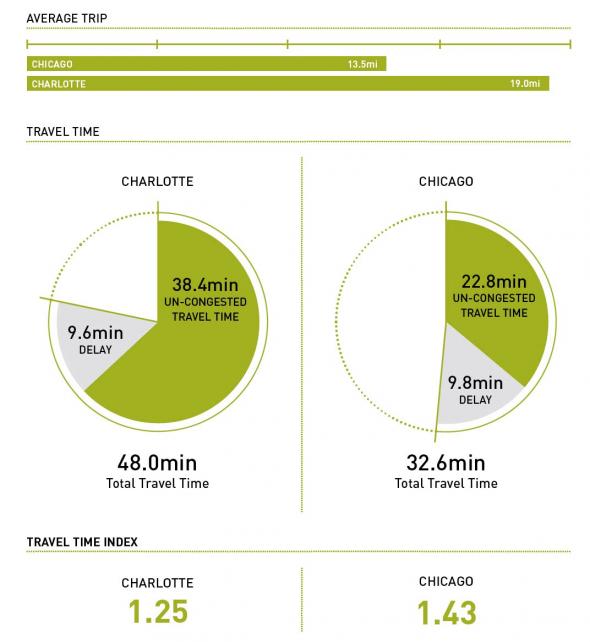
Example of Travel Time Index, from the CEOs for Cities report “Driven Apart”
The Texas Transportation Institute has recently started to produce a Planning Time Index for cities. This is a travel time reliability measure that is a multiple of the off-peak travel time needed to be late only 1 day a month (95th percentile). For cities in the range of 1 to 3 million population (like San Antonio), the average index value is 3.12 – meaning a person should allow 62 minutes during peak period to reliably complete a trip that takes 20 minutes during free-flow travel periods. The index value for San Antonio is 2.91, while the index for Austin is 4.26. This means we’ve got lower-than-average traffic congestion in our city! The trick will be maintaining that number as our city continues to grow and evolve (because we are a city on the rise!).
As a community, we have set a goal to make transportation in San Antonio a “model of efficiency and environmental sustainability” by the year 2020.
Traffic and congestion in our city is a complex issue. We’re constantly working to make transportation in this city more efficient and sustainable, but one of the keys to making sure our work is going in the right direction is making sure our data is meaningful. It may not be something you think about on a daily basis, but measuring the traffic congestion in our city is going to help us stay on track to fulfill the SA2020 vision for transportation in San Antonio, something that will not only affect our city’s overall future, but also what your daily drive to work looks like seven years from now, and beyond.
